


Table of contents
For this, we will be using a JavaScript library called Gauge.js. Let's get started!
📜 Add The Library To Static Resources
Here is how:
Click the button gauge.min.js (second button below the heading on the top of the page)
You should be taken to https://bernii.github.io/gauge.js/dist/gauge.min.js
Save the file onto your machine
Upload to Static Resources with the name
gaugeJS
🔮 Create The Chart
gaugeChart.html
<template>
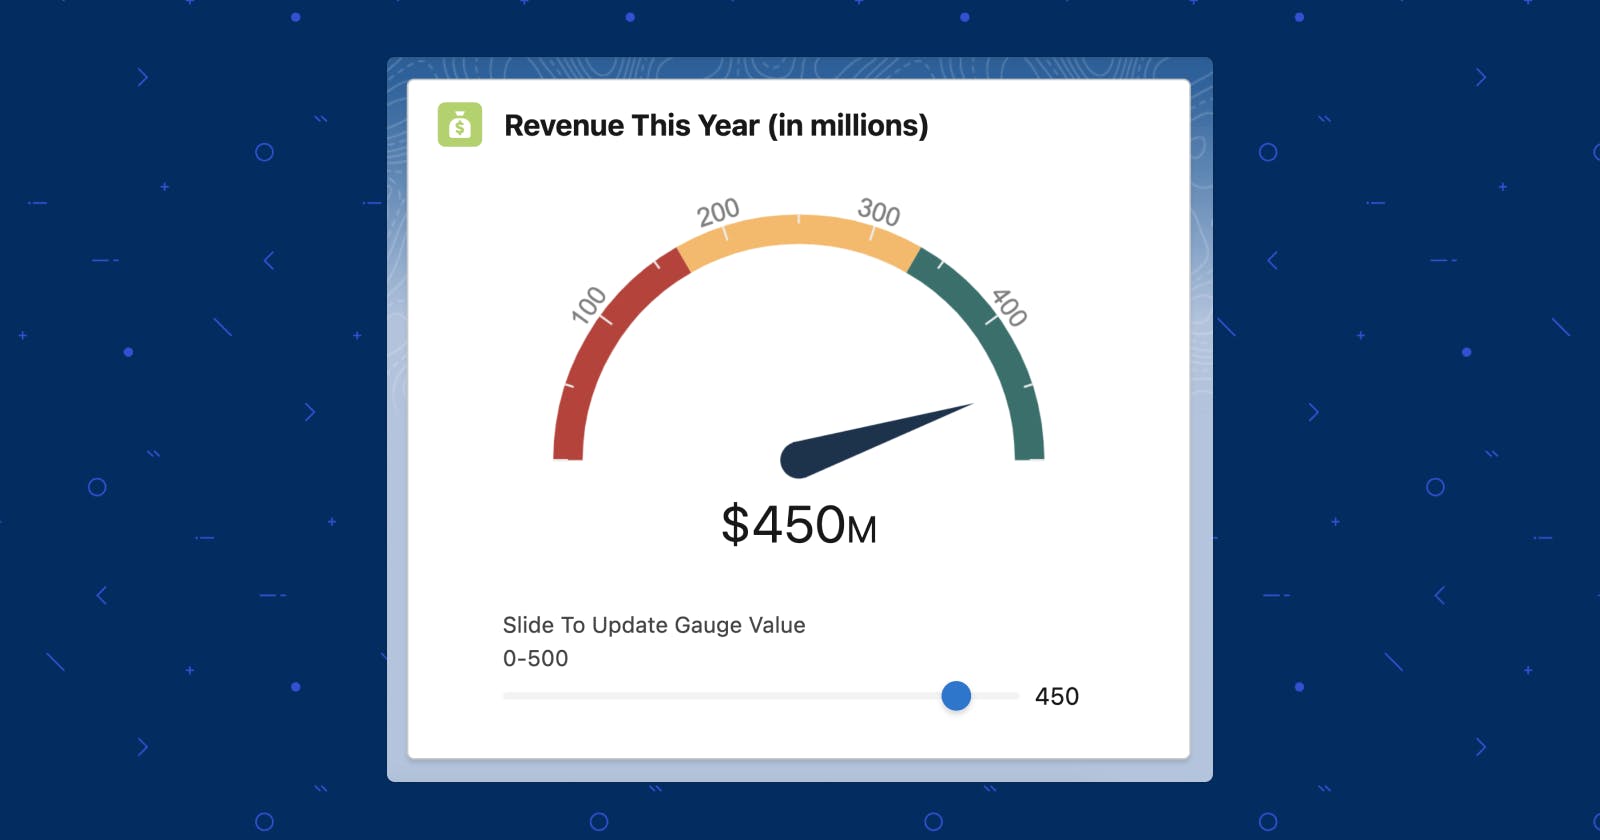
<lightning-card variant="Narrow" title="Revenue This Year (in millions)" icon-name="custom:custom17">
<div class="slds-card__body slds-card__body_inner">
<!-- Gauge.js uses HTML canvas element to create charts so here is one -->
<center>
<canvas style="width:85%" lwc:ref="chart" lwc:dom="manual"></canvas>
</center>
<!-- Element to show the current Gauge value -->
<div class="slds-text-heading_large slds-text-align_center">
$
<span lwc:ref="gaugeValue" lwc:dom="manual"></span>
<span class="slds-text-heading_medium">M</span>
</div>
<!-- Example slider to demonstrate how to update the gauge value -->
<div class="slds-m-vertical_large slds-grid slds-grid_align-center">
<lightning-slider label="Slide To Update Gauge Value" size="medium" value="450" max="500"
onchange={handleSliderChange}>
</lightning-slider>
</div>
</div>
</lightning-card>
</template>
gaugeChart.js
import { LightningElement, track } from 'lwc';
import { loadScript } from "lightning/platformResourceLoader";
import gaugeJS from '@salesforce/resourceUrl/gaugeJS';

export default class GaugeChart extends LightningElement {
   // Think of this like a global variable, it holds the reference to chart we'll be drawing so the chart can be modified from other methods
   @track chart;

   // Gauge chart config
   chartConfig = {
      angle: 0, // The span of the gauge arc
      lineWidth: 0.12, // The line thickness
      radiusScale: 1, // Relative radius
      pointer: {
         length: 0.40, // // Relative to gauge radius
         strokeWidth: 0.06, // The thickness
         color: '#17324D' // Fill color
      },
      staticZones: [ // The red, yellow, green coloured zones on the gauge
         {
            strokeStyle: '#C23934',
            min: 0,
            max: 167
         },
         {
            strokeStyle: '#FDB75D',
            min: 167,
            max: 333
         },
         {
            strokeStyle: '#24716B',
            min: 333,
            max: 500
         }
      ],
      staticLabels: {
         font: "14px Arial",
         labels: [100, 200, 300, 400], // Print labels at these values
         color: "#818181", // Optional: Label text color
         fractionDigits: 0 // Optional: Numerical precision. 0=round off.
      },
      renderTicks: { // The grey tick lines on the gauge
         divisions: 5,
         divWidth: 0.6,
         divLength: 0.5,
         divColor: '#ecebea',
         subDivisions: 2,
         subLength: 0.3,
         subWidth: 0.6,
         subColor: '#ecebea'
      },
      limitMin: false, // If true, the min value of the gauge will be fixed
      limitMax: false, // If false, max value increases automatically if value > maxValue
      colorStart: '#6FADCF', // Colors
      colorStop: '#8FC0DA', // just experiment with them
      strokeColor: '#E0E0E0', // to see which ones work best for you
      generateGradient: true,
      highDpiSupport: true // High resolution support
   };

   connectedCallback() {
      // Load Gauge.js
      loadScript(this, gaugeJS).then(() => {
         // HTML canvas for gauge chart
         const gaugeChartElement = this.refs.chart;

         // HTML element for animated number counter
         const gaugeValueHolder = this.refs.gaugeValue;

         if(gaugeChartElement && gaugeValueHolder) {
            // Draw the gauge chart
            this.chart = new Gauge(gaugeChartElement).setOptions(this.chartConfig);

            // You can also set other chart options this way
            this.chart.maxValue = 500;
            this.chart.setTextField(gaugeValueHolder);
            this.chart.setMinValue(0);
            this.chart.animationSpeed = 10;
            this.chart.set(450);
         }
      });
   }

   handleSliderChange(evt) {
      // Get the slider value
      let newGaugeValue = Number(evt.currentTarget.value)

      // Update the gauge with the new slider value
      this.chart.set(newGaugeValue);
   }

}
this.chart.set(<number>) is the method that is used to update the Gauge chart value after the chart is drawn.
Happy Charting! 🚀